Overview
Quantify Service
The Quantify Service is a powerful Data Exploration and Visualization solution built on Metabase, an open-source Business Intelligence tool. It allows you to create custom SQL queries, visualize results, and share insights with your team, all with an intuitive user interface.
Metabase provides a flexible, user-friendly environment for querying databases, creating dashboards, and exploring data without requiring advanced SQL knowledge, though SQL expertise unlocks its full potential.
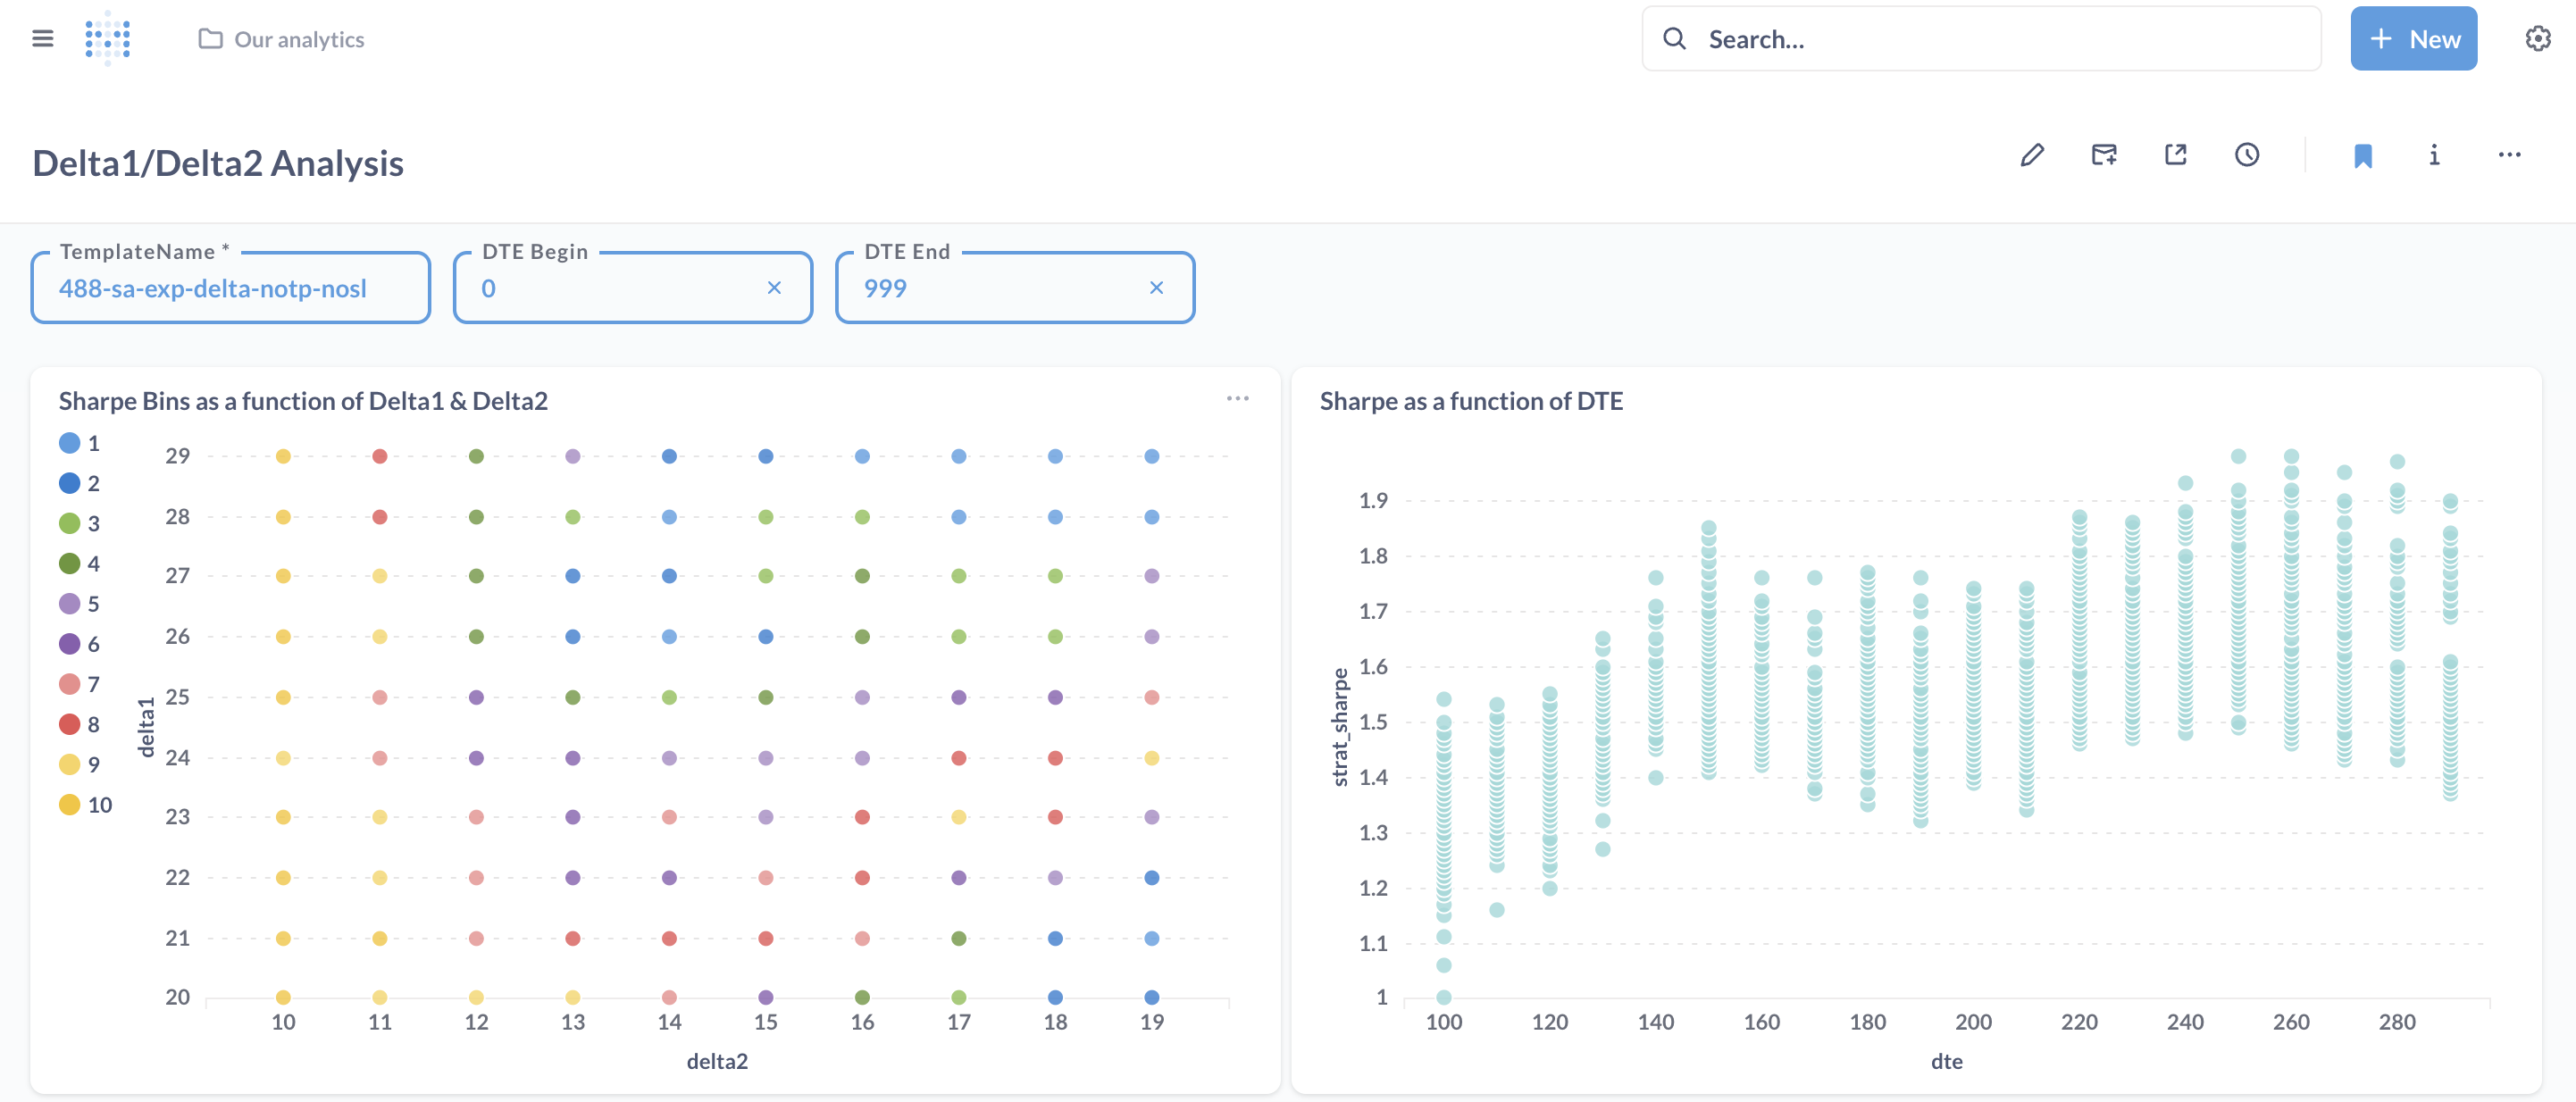
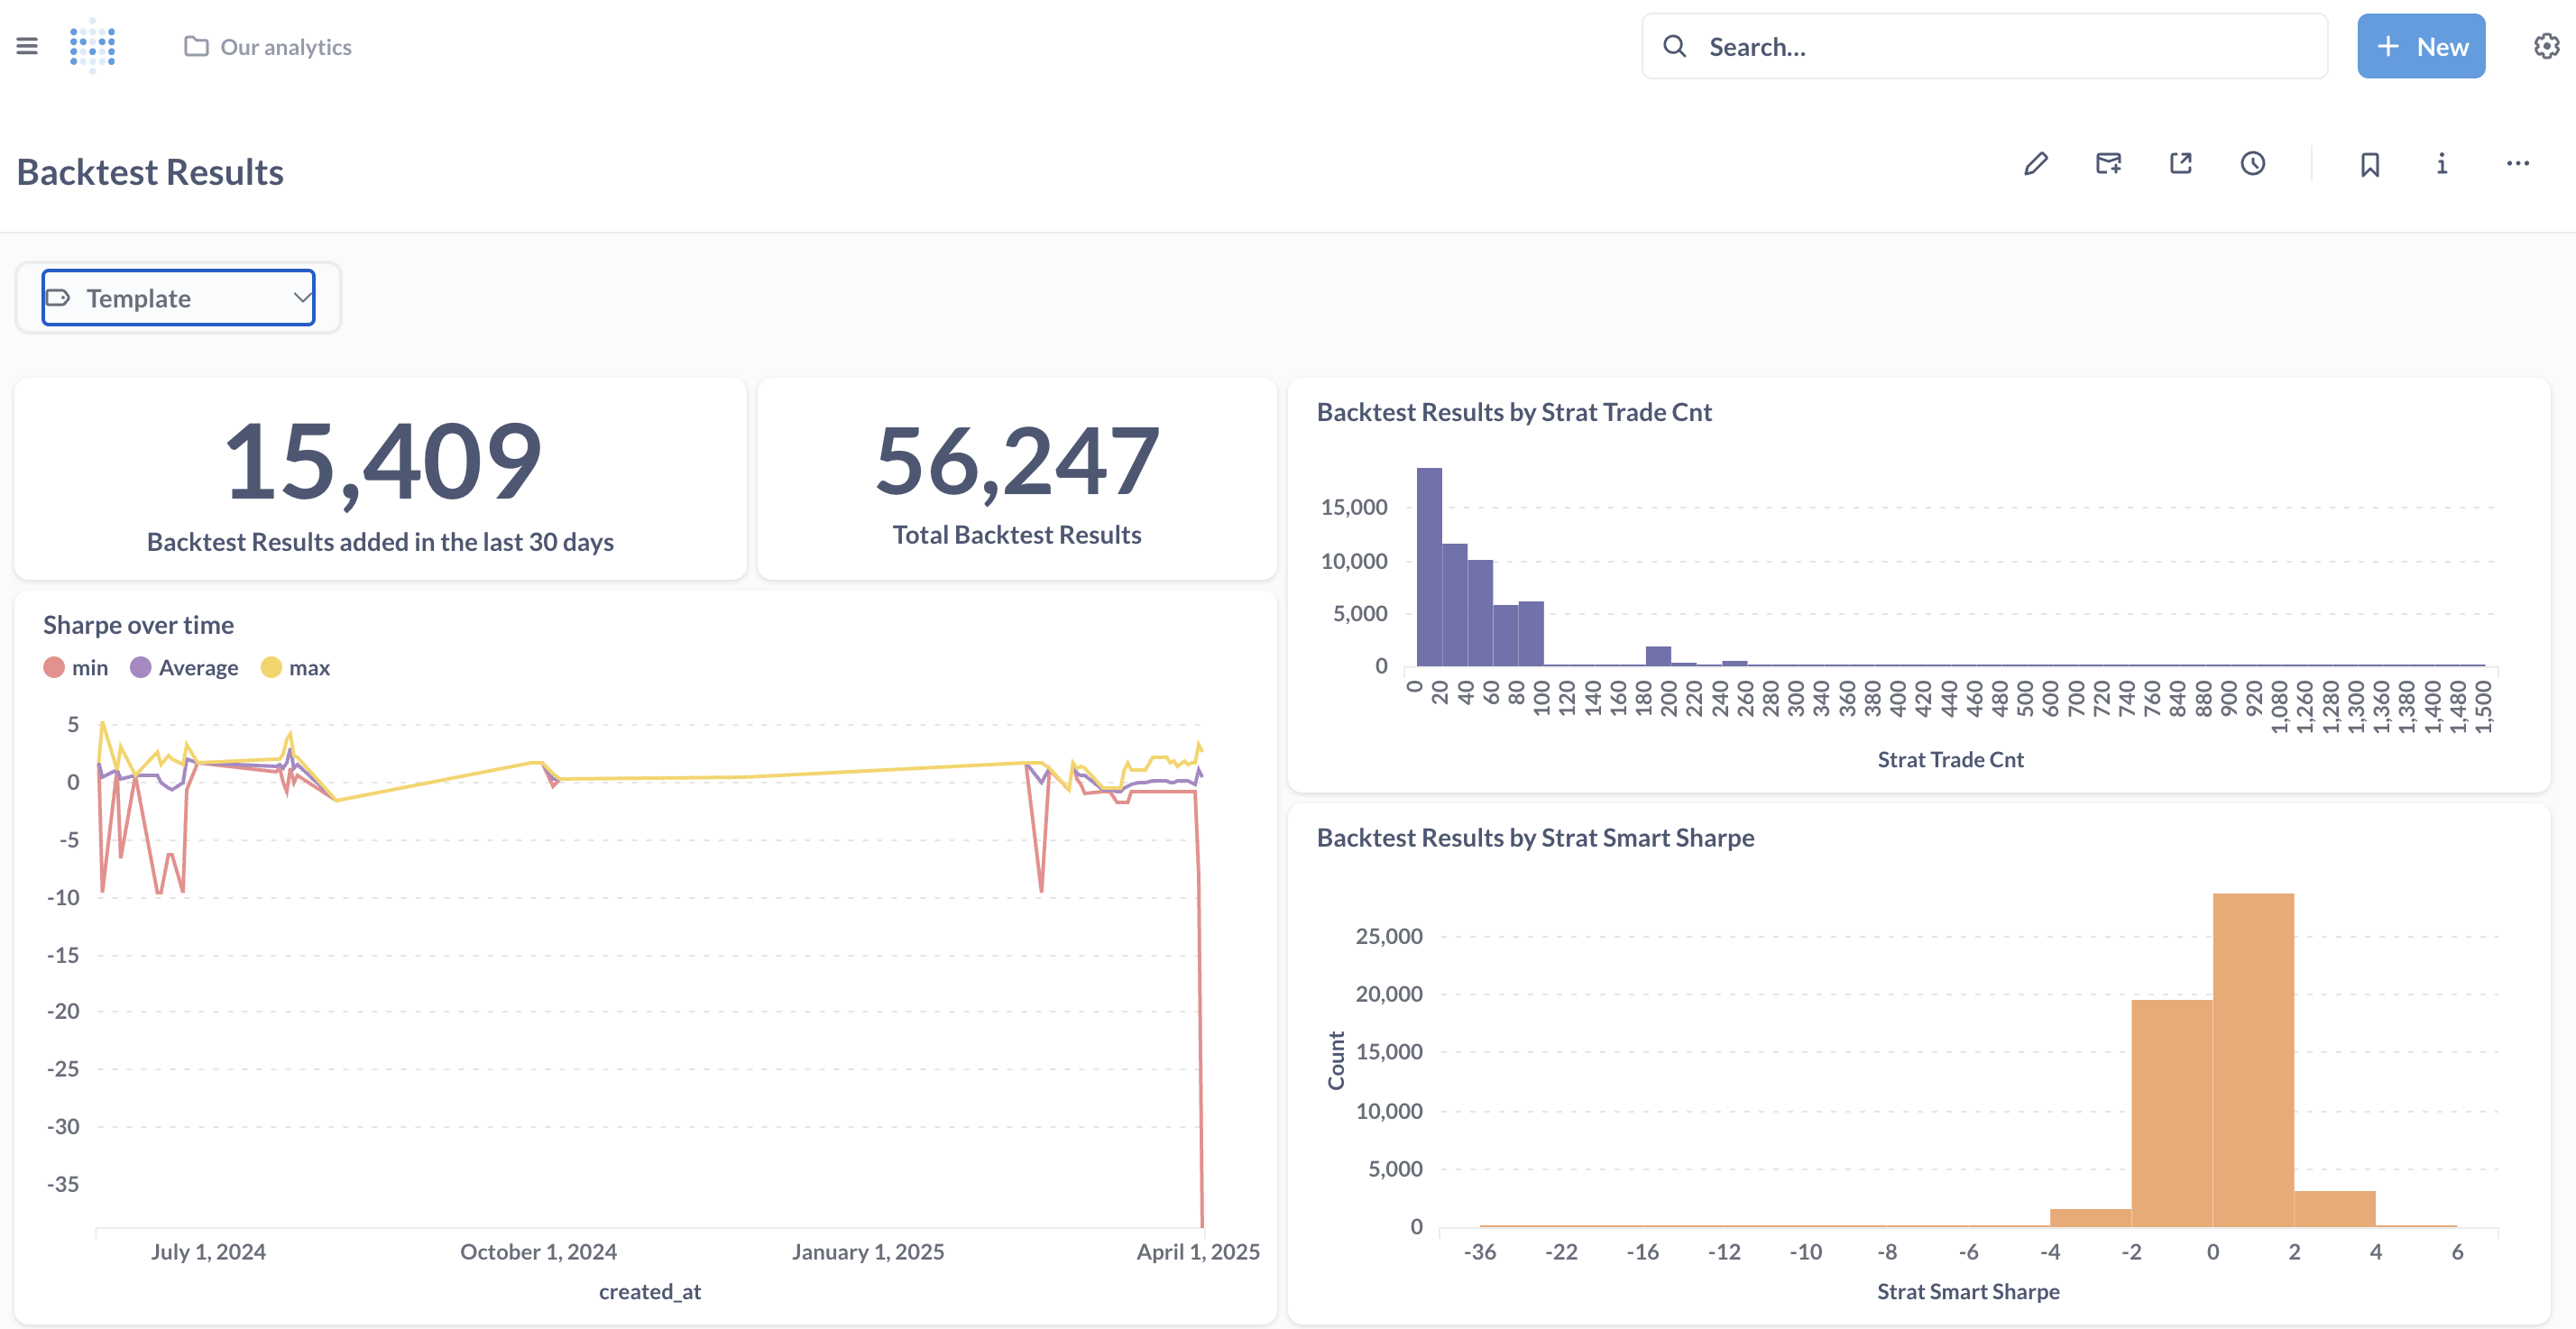
Visualization samples
Key Features
- SQL Query Interface: Write and execute custom SQL queries against your Backtest Results
- Interactive Visualizations: Create charts, graphs, and dashboards from query results
- Data Exploration: Drill down into specific metrics and analyze patterns
- Collaboration Tools: Share queries, visualizations, and insights with team members
Available Databases
Quantify provides access to two primary databases:
- backdb: A relational database containing all backtest results with strategy performance metrics from your cluster
- rundirs: Access to MesoSim run directories for each backtest via DuckDB, providing access to the event logs and position data for post-processing.
In the following sections, you'll find detailed information about the databases, their schemas, and example queries to get you started with Quantify.
Creating Dashboards
Feel free to extend the Questions and Dashboards available in Metabase based on your own reporting needs.