Strategy Optimization
Overview
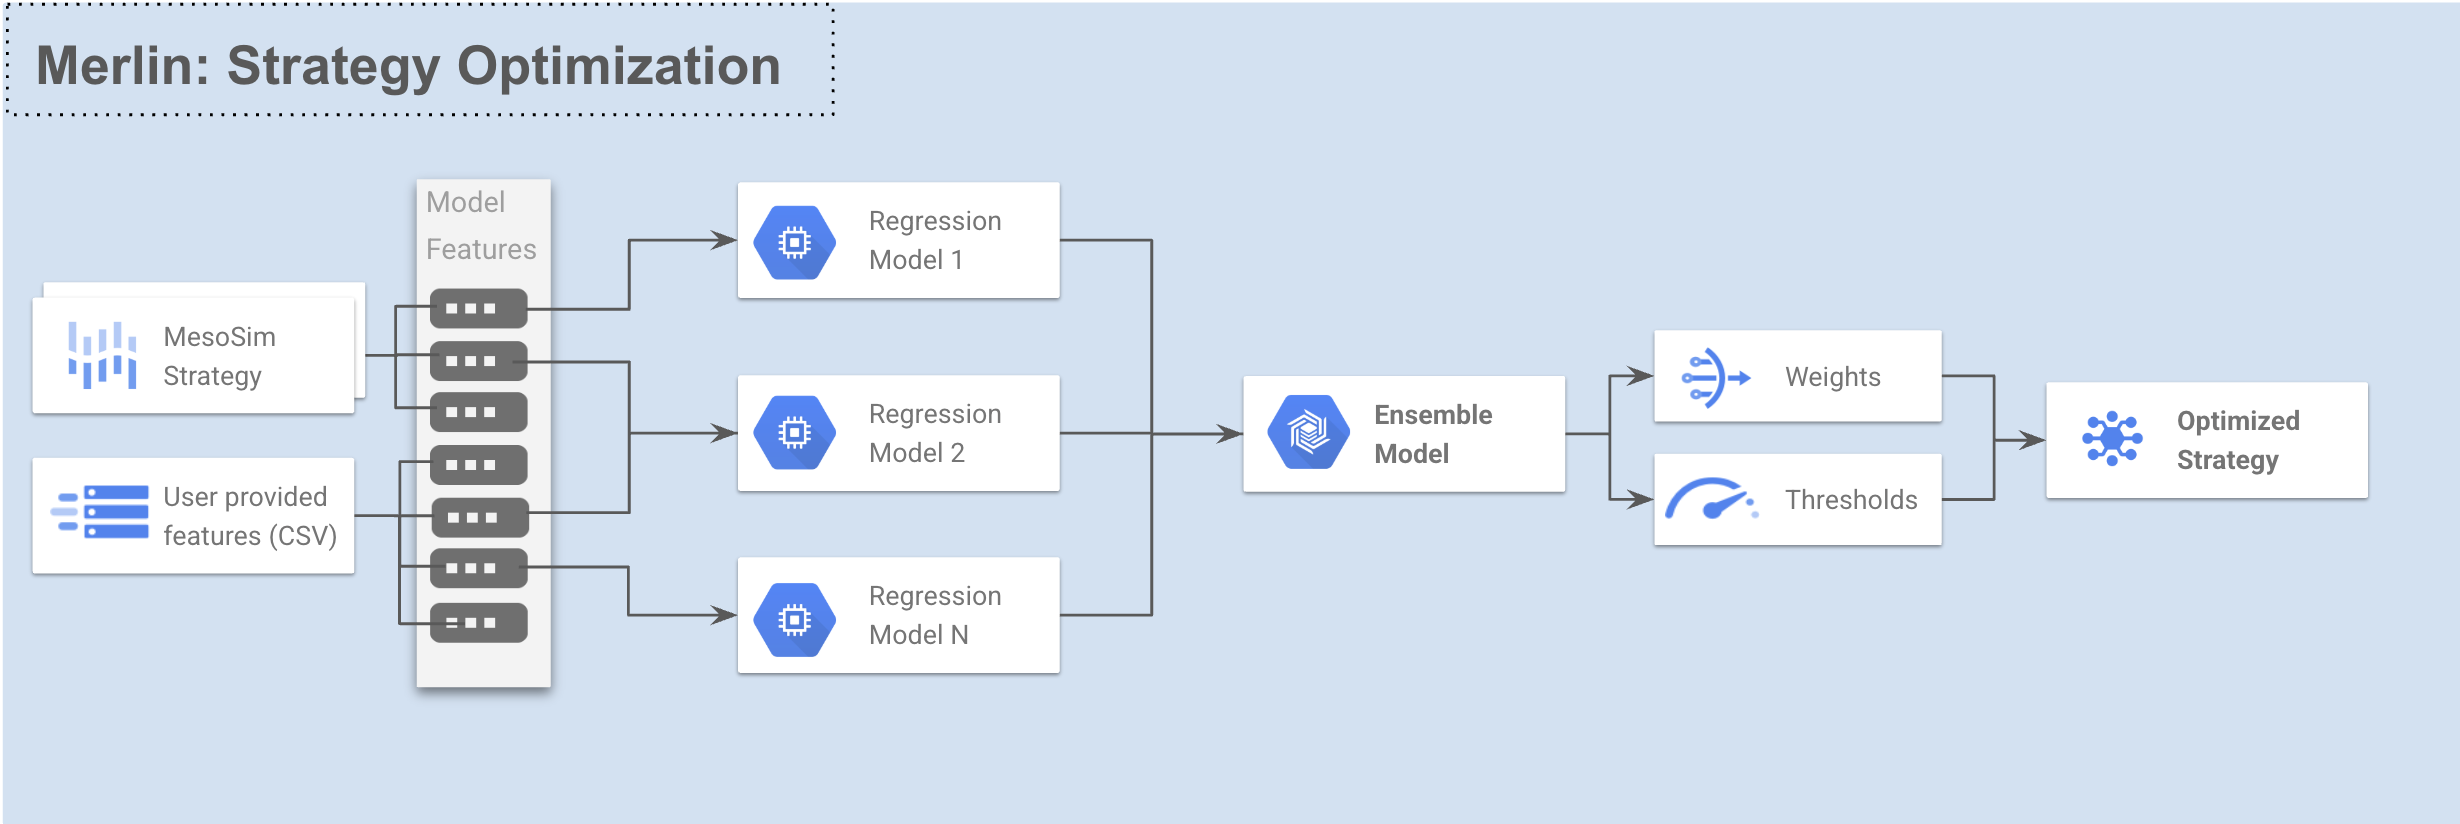
Strategy optimization is a core capability of Merlin that helps improve trading performance by applying machine learning techniques. Using the Stepwise Ensemble for Trade Selection (SETS) model from Q-API, Merlin creates predictive models that can filter trade entries.
The optimization process uses walkforward testing to ensure model robustness and reduce overfitting, providing more reliable Out-Of-Sample performance estimates than traditional In-Sample optimization.
Optimization Process
The strategy optimization workflow in Merlin follows these steps:
- Data Collection: Extract strategy performance data using MesoSim backtests
- Feature Engineering: Calculate predictive features from option chain and user provided data
- Walkforward Testing: Run walk-forward optimization using SETS model
- Trade Enhancement: Apply models to filter trades for the last fold. These runs later can be used in MesoLive for live trading
- Performance Evaluation: Analyze the results of the optimized strategy
The optimization process is parallelized for efficiency, with the degree of parallelism controlled by the --backtests-in-flight and --model-calls-in-flight parameters.
These parameters should be adjusted to match your Cluster's size. These parameters are provided to you during your on-boarding process. If you need help identifying the parallelization values for your cluster, please reach out to Support
SETS Regression Types
Merlin supports three types of regression models through the SETS model:
Linear Regression
The default regression type that models linear relationships between features and targets. Best suited for:
- Fast training requirements
- Well-designed feature sets
- Cases where overfitting risk needs to be minimized
Logistic Regression
Designed for binary classification tasks that discriminate between winning and losing trades. Key characteristics:
- Uses binary targets (win/loss) instead of continuous profit values
- More robust against outliers in predictors compared to linear regression
Quadratic Regression
Captures nonlinear relationships through second-order polynomial terms. Features include:
- Adds squared terms and pairwise cross-products of original features
- Balances complexity between linear models and highly flexible methods
- Handles curved relationships while maintaining reasonable training speed
- Example expansion: Features
[A, B]become[A, B, A², A×B, B²]
The quadratic approach is particularly useful when linear models underperform, but you want to avoid the overfitting risks of more complex nonlinear methods.
Configuration Parameters
Strategy optimization is configured through a model configuration file in JSON format:
Basic Parameters
| Parameter | Description |
|---|---|
| StartDate | Start date for the optimization |
| EndDate | End date for the optimization |
| TradeEnhMode | Mode for trade enhancement ("long-tails", "long-and-neutral", etc) |
| PTSLTarget | Profit target / stop loss configuration |
Model Configuration
The Model section controls the SETS model behavior:
| Parameter | Description |
|---|---|
| TargetMetric | Optimization target (RSquare, ProfitFactor, PTSLOpt, etc.) |
| WindowSize | Number of trading days in each training window |
| MinTimeInMarketPct | Minimum fraction of time the strategy must be in the market |
| CompressTargetOutliers | Boolean to enable outlier compression |
| ModelMaxFeatures | Maximum features per model (enables stepwise selection when > 0) |
| ModelStepwiseMemory | Number of models to remember during stepwise selection |
| ModelRegressionType | The regression type for the model: Linear, Logistic, or Quadratic |
| RegressionModelConfigs | Per-model configuration including features, max features, stepwise memory, and regression type |
| EnsembleMode | How to combine models (Disabled, Average, Optimized) |
| EnsembleModelCount | Number of models in the ensemble |
| EnsembleMaxModels | Maximum models to select for ensemble |
| EnsembleStepwiseMemory | Models to remember during ensemble creation |
RegressionModelConfig Options
The RegressionModelConfigs parameter allows fine-grained control over individual regression models within the ensemble:
| Field | Description |
|---|---|
| Features | List of specific features to use in this model. When specified, only these features will be considered. |
| MaxFeatures | Maximum number of features for this specific model (overrides global ModelMaxFeatures). |
| StepwiseMemory | Number of models to remember during stepwise selection for this model (overrides global ModelStepwiseMemory). |
| RegressionType | The regression type for this specific model: Linear, Logistic, or Quadratic (overrides global ModelRegressionType). |
Using the RegressionModelConfigs parameter allows you to create specialized models within your ensemble that focus on different aspects of your trading system. For example, you could create one model focused on volatility metrics and another focused on price action or Greeks.
This feature requires Q-API version 1.3 or later. See the Q-API SETS Model documentation for more details.
Feature Configuration
The Features section controls feature engineering:
| Parameter | Description |
|---|---|
| AddIVs | Include implied volatility features |
| AddGreeks | Include option Greeks features |
| AddPrices | Include price-based features |
| AddDerivedMetrics | Include derived and ratio metrics |
| AddUserVars | Include user variables from the strategy definition file |
| AddFeatureTransforms | Apply transformations to features |
| AddCSV | Path to CSV file with additional features |
Feature Selection Configuration
Two feature selection methods are available in Merlin:
Cramér's V Configuration
The CramersV subsection configures Cramér's V feature selection:
| Parameter | Description |
|---|---|
| Enabled | Enable Cramér's V feature selection |
| Threshold | Minimum score to include a feature |
| FeatureGrouping | How to group features ("bins" or "tails") |
| FeatureBinsOrTails | Number of bins or tail percentage |
| TargetGrouping | How to group targets ("bins" or "sign") |
| TargetBins | Number of target bins when using "bins" grouping |
MIFS Configuration
The Mutual Information based Feature Selection (MIFS) model is also available for feature selection through the Predictor Discovery process. MIFS uses information theory principles to systematically build an optimal set of non-redundant predictors that maximize predictive power.
Key characteristics of MIFS feature selection:
- Redundancy Minimization: Unlike correlation-based methods, MIFS specifically considers only the information component related to the target variable
- Iterative Selection: Features are selected one by one, with each new feature providing maximum incremental predictive power
- Statistical Validation: Monte Carlo Permutation Testing ensures each feature's contribution is statistically significant
MIFS accepts the following parameters:
| Parameter | Description | Default |
|---|---|---|
| Enabled | Enable MIFS feature selection | false |
| MCpThreshold | Monte Carlo p-value threshold for statistical significance | 0.10 |
| CramersVThreshold | Cramer's V threshold for feature filtering (optional) | null |
| MIScoreThreshold | Mutual Information score threshold (optional) | null |
| FeatureGrouping | How to group feature values ("bins" or "tails") | "bins" |
| FeatureBinsOrTails | Number of bins or tail percentile for feature grouping | 2 |
| TargetGrouping | How to group target values ("bins" or "sign") | "bins" |
| TargetBins | Number of bins for target variable when using bin grouping | 3 |
MIFS and Cramér's V Feature Selection cannot be enabled simultaneously. Since MIFS contains the Cramér's V values for each selected feature, you can use MIFS to obtain both the selected features and their Cramér's V scores.
While Cramér's V is a fast and effective method for initial feature screening, MIFS provides a more comprehensive approach resulting in longer runtimes.
Please refer to Predictor Discovery for more details on both Cramér's V and MIFS feature selection methods.
Example Usage
Command Line
merlin optimize-strategy configs/strategies/boxcar-strategy.json configs/strategies/boxcar-model-cfg.json --include-last-fold
Configuration Example
{
  "StartDate": "2016-08-20",
  "EndDate": "2025-01-31",
  "TradeEnhMode": "long-and-neutral",
  "PTSLTarget": "pt-off-sl-beyond-max-loss",
  "Model": {
    "TargetMetric": "RSquare",
    "WindowSize": 300,
    "MinTimeInMarketPct": 0.05,
    "CompressTargetOutliers": false,
    "ModelMaxFeatures": 2,
    "ModelStepwiseMemory": 20,
    "ModelRegressionType": "Linear",
    "RegressionModelConfigs": {
      "MODEL_0": {
        "Features": ["entry_underlying_iv_by_hv_ratio", "entry_pds_long_underlying_hv_ratio"],
        "RegressionType": "Logistic"
      },
      "MODEL_1": {
        "Features": ["entry_pos_vega", "entry_pos_theta", "entry_leg_longs_iv"],
        "MaxFeatures": 2,
        "StepwiseMemory": 15,
        "RegressionType": "Quadratic"
      }
    },
    "EnsembleMode": "Optimized",
    "EnsembleModelCount": 2,
    "EnsembleMaxModels": 2,
    "EnsembleStepwiseMemory": 20
  },
  "Features": {
    "AddIVs": true,
    "AddGreeks": false,
    "AddPrices": false,
    "AddDerivedMetrics": true,
    "AddUserVars": false,
    "AddFeatureTransforms": false,
    "AddCSV": null,
    "CramersV": {
      "Enabled": true,
      "Threshold": 0.5,
      "FeatureGrouping": "tails",
      "FeatureBinsOrTails": 0.05,
      "TargetGrouping": "bins",
      "TargetBins": 3
    },
    "MIFS": {
      "Enabled": false,
      "MCpThreshold": 0.1,
      "CramersVThreshold": null,
      "MIScoreThreshold": null,
      "FeatureGrouping": "bins",
      "FeatureBinsOrTails": 2,
      "TargetGrouping": "bins",
      "TargetBins": 3
    }
  }
}
Trade Enhancement Modes
Merlin supports numerous modes for applying model predictions to trading decisions:
-
long-tails: Only takes trades when the model prediction is positive, above the threshold.
- If prediction > LongThreshold: Take the trade
- Otherwise: Skip the trade
-
long-and-neutral: Takes trades when the model prediction is positive or neutral and skips when negative:
- If prediction > LongThreshold: Take the trade
- If prediction < ShortThreshold: Skip the trade
- Otherwise: Take the trade with default sizing
-
levered-long-and-neutral: Doubles down on long trades and taking neutral ones.
- If prediction > LongThreshold: Take the trade with leverage=2
- If prediction < ShortThreshold: Skip the trade
- Otherwise: Take the trade with default sizing
-
short-tails: Takes trades when the model prediction is negative, below the threshold.
- If prediction < ShortThreshold: Take a short position (inverted MesoSim structure)
- Otherwise: Skip the trade
-
long-and-short-tails: Takes trades in both directions based on model predictions:
- If prediction > LongThreshold: Take a long position
- If prediction < ShortThreshold: Take a short position
- Otherwise: Skip the trade
Profit Target and Stop Loss Optimization
Merlin can optimize profit targets and stop losses using a Grid Search algorithm.
The PTSLTarget parameter controls how profit targets and stop losses are chosen:
sharpeandsortino: A 20x20 Grid Search (based on the Underlying Price) is made. The best PT/SL combination that maximizes the metric is used.pt-off-sl-beyond-max-loss: Profit Target is disabled and Stop Loss is set 10% beyond the maximum loss point.
When TargetMetric is set to PTSLOpt then no SETS optimization is done, just the
best PT/SL combination is used.
Results Analysis
Merlin provides strategy performance information on the screen after completing the run. The following information is displayed:
- Models' Feature statistics: The usage frequency of each feature in the models
- Runs:
- data-collect: The initial, unfiltered, raw run to collect historical data for the whole-period
- wf-oos-model: The optimized run where trade entries are filtered based on the model output
- wf-oos-model-ptsl: The optimized run with profit target and stop loss levels
- wf-oos-base: The unfiltered baseline run. Subset of the data-collect run.
- lastfold-base: The unfiltered MesoSim run covering the last fold.
- lastfold-model: The optimized run covering the last fold. The model is represented as Entry.AbortConditions
- lastfold-model-ptsl: The optimized run covering the last fold with profit target and stop loss levels
To judge the goodness of the model wf-oos-model run should be compared to wf-oos-base run.
For the last fold, lastfold-model should be compared to lastfold-base.
Example On-screen output
$ merlin optimize-strategy configs/strategies/boxcar-strategy.json configs/strategies/boxcar-model-cfg.json --include-last-fold
Model config: StrategyOptimizerConfig(StartDate='2016-08-20', EndDate='2025-01-31', TradeEnhMode='long-and-neutral', ...)
boxcar enriched_df columns: ['Symbol', 'StrategyNAV', 'PositionId', 'entry_dow', 'entry_leg_pcs_long_iv', 'entry_leg_pcs_short_iv', ...]
Models' Feature statistics
298: CONSTANT
149: entry_underlying_iv_by_hv_ratio
149: entry_pds_long_underlying_hv_ratio
149: MODEL_1
134: entry_underlying_hv
105: entry_pds_long_underlying_iv_ratio
52: MODEL_0
27: entry_leg_pds_long_iv
15: entry_leg_pds_short_iv
8: entry_leg_pcs_long_iv
5: entry_pcs_long_by_pcs_short_iv_ratio
3: entry_pds_long_by_pds_short_iv_ratio
1: entry_underlying_iv
--------------------------------------------------------------------------------------------------------------------------
| Name | Period | TradeCnt | Sharpe | Sortino | CAGR | MaxDD | Alpha | Beta | Note
| data-collect | 2016-08-22 - 2025-01-30 | 449 | 0.60 | 0.90 | 16.38 | -61.42 | 0.14 | 0.59 | backtest id: 3cfc0d18-e735-4390-a9f7-617887742df2
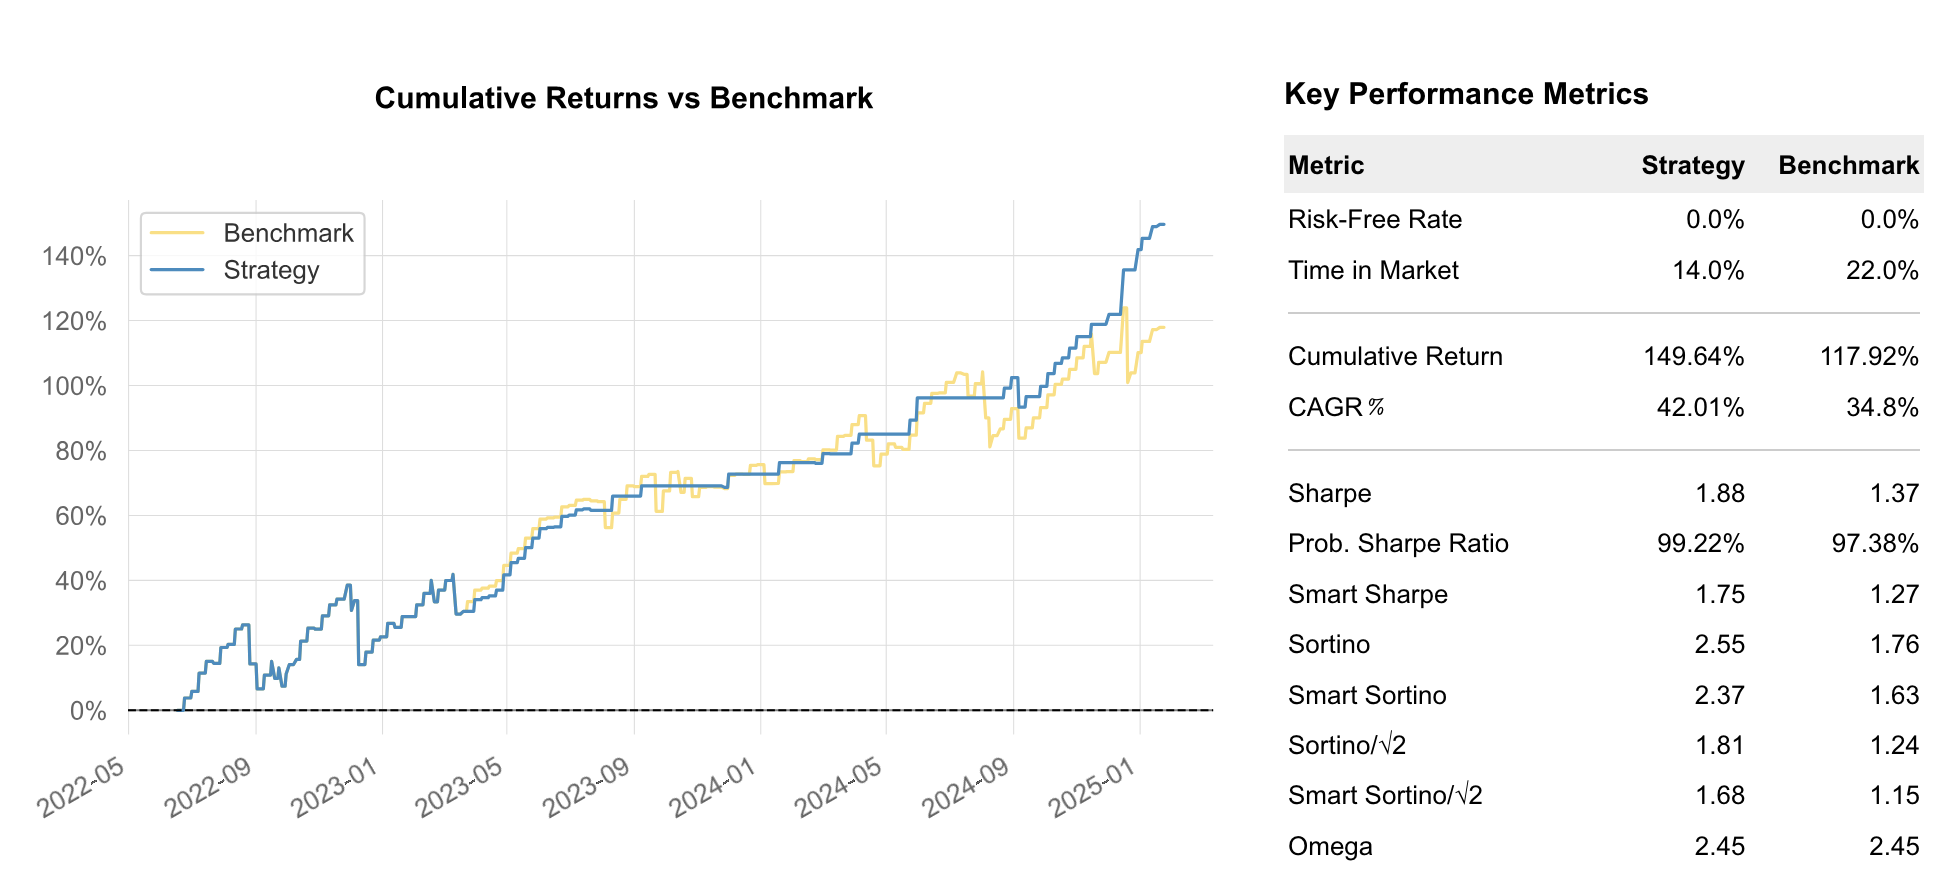
| wf-oos-model | 2022-06-10 - 2025-01-24 | 95 | 1.88 | 2.55 | 42.01 | -17.69 | 0.15 | 0.68 | sets model
| wf-oos-model-ptsl | 2022-06-10 - 2025-01-24 | 95 | 1.88 | 2.55 | 42.01 | -17.69 | 0.15 | 0.68 | sets model with profit target and stop loss
| wf-oos-base | 2022-06-10 - 2025-01-24 | 149 | 1.37 | 1.76 | 34.80 | -17.69 | n/a | n/a | unfiltered/baseline
| lastfold-base | 2018-07-16 - 2025-03-20 | 375 | 0.40 | 7.77 | 15.41 | -98.65 | 4.29 | -2.60 | https://portal.test-lab.mesosim.io/backtests/52eb8c0a-2caa-461b-ba1b-d2880fa1f16c
| lastfold-model | 2018-07-16 - 2025-03-20 | 343 | 0.99 | 1.23 | 18.04 | -35.70 | 0.13 | 0.43 | https://portal.test-lab.mesosim.io/backtests/661ec0e2-8416-4a6d-b9e4-cd051593712c
| lastfold-model-ptsl | 2018-07-16 - 2025-03-20 | 315 | 0.84 | 1.06 | 23.99 | -59.02 | 0.19 | 0.70 | https://portal.test-lab.mesosim.io/backtests/fd4382e4-49a0-4964-a30b-41d7f2799fc1
In this run, the model improved the Out of Sample performance from 1.37 to 1.88 while reducing trade entries from 149 to 95. The last-fold's In Sample performance also increased from 0.40 to 0.99.
Additional files
Merlin generates several files to analyze optimization results.
The results are stored in the merlin-results directory under a run specific directory:
$ ls -l merlin-results/2025-03-25_104548-strategy-boxcar
total 2792
-rw-r--r--  1 myrddin  staff    3852 Mar 25 10:45 boxcar-strategy.json
-rw-r--r--  1 myrddin  staff    1018 Mar 25 10:45 boxcar-model-cfg.json
-rw-r--r--  1 myrddin  staff    4560 Mar 25 10:52 merlin_2025-03-25_104548.log
-rw-r--r--  1 myrddin  staff  184752 Mar 25 10:52 walkforward_df.csv
-rw-r--r--  1 myrddin  staff  603600 Mar 25 10:52 wf-model_pnl-vs-base.html
-rw-r--r--  1 myrddin  staff    2906 Mar 25 10:52 wf-model_pnl-vs-base.stats
-rw-r--r--@ 1 myrddin  staff  603600 Mar 25 10:52 wf-model_ptsl_pnl-vs-base.html
-rw-r--r--  1 myrddin  staff    2906 Mar 25 10:52 wf-model_ptsl_pnl-vs-base.stats
The wf-model_pnl-vs-base.html and wf-model_ptsl_pnl-vs-base.html files contain the performance comparison between
the optimized strategy and the baseline strategy for the walkforward Out Of Sample period.
Tearsheet
Last Fold Testing
The --include-last-fold option runs an additional test on the most recent data.
This provides the most current model and can be used for live trading in MesoLive.